Back to projects
Industrial Hybrid Energy & Power SystemsCompleted Technical Simulation Study

Manufacturing Factory Grid–Diesel–PV Cost Reduction & Power System Analysis

Independent engineering study for a manufacturing facility combining an 8,760-hour load and dispatch model, rooftop PV sizing and energy-yield simulation, and ETAP power-system studies for grid, diesel and PV operating scenarios.

Manufacturing Factory Grid–Diesel–PV Cost Reduction & Power System Analysis project visual

Project image

Location

Kano, Nigeria

Period

Aug - Sep 2026

01 / Scope of Work

Work modelled, designed or delivered.

  1. 01

    Cleaned and structured an 8,760-hour annual load profile in Python, including grid-availability status and baseline grid/diesel dispatch.

  2. 02

    Compared six PV capacities from 1.198 MWp to 2.874 MWp to assess solar utilisation, curtailment, diesel displacement and operating-cost savings.

  3. 03

    Modelled the 2.874 MWp maximum-roof, zero-export PV scenario in PVsyst using 5,423 × 530 Wp modules and 22 × 100 kW inverters.

  4. 04

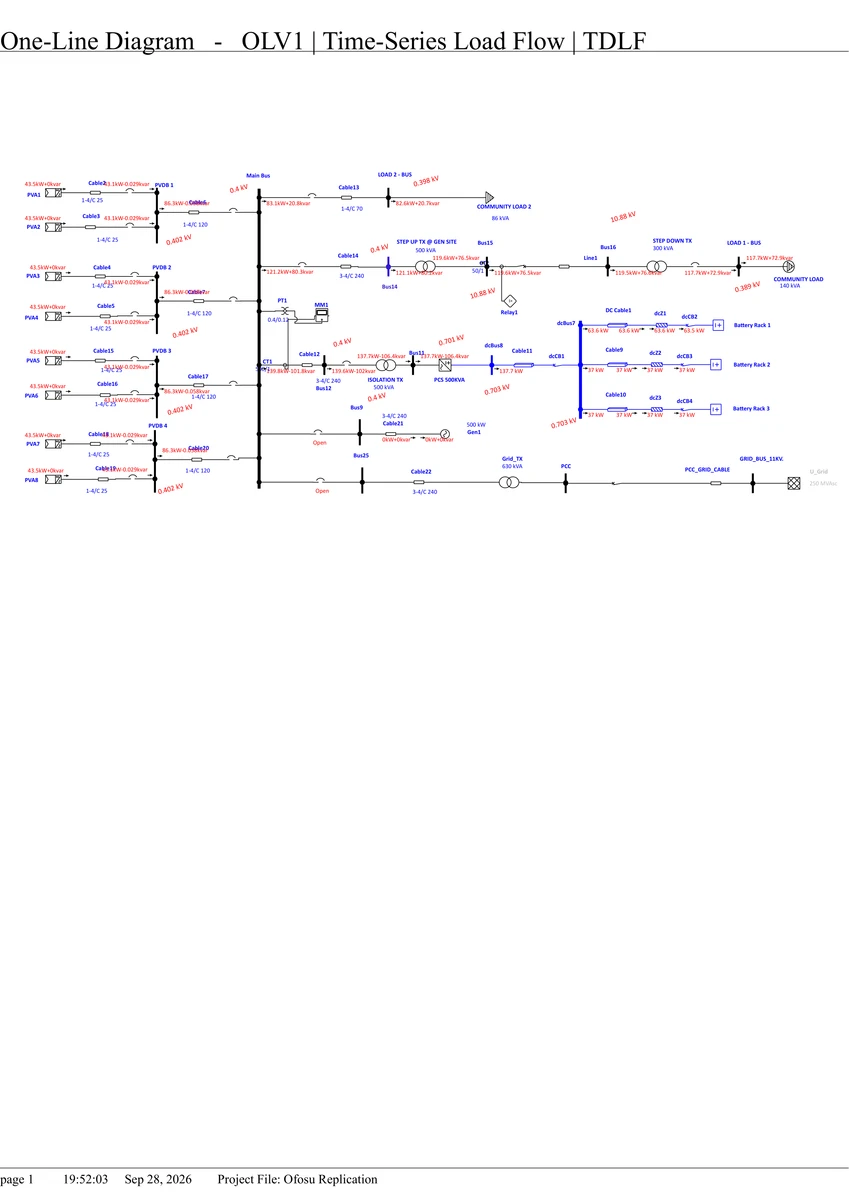
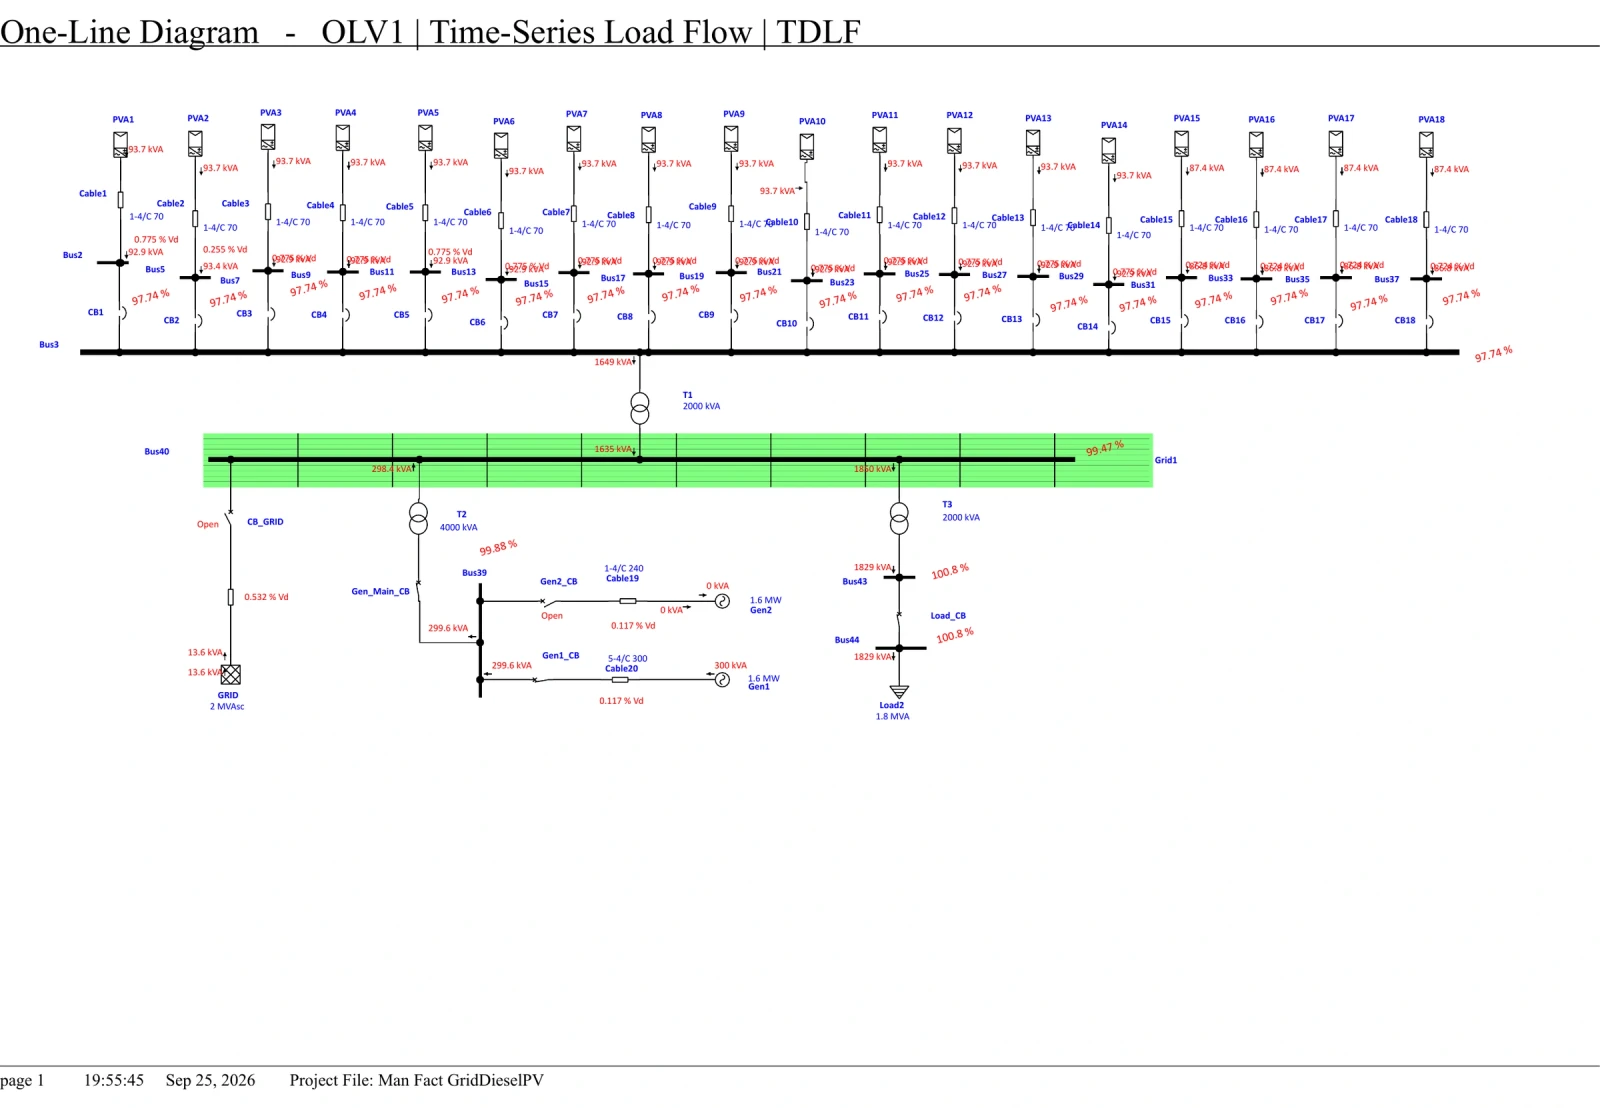
    Developed the grid/diesel/PV electrical network in ETAP and evaluated load flow and time-series load-flow operating conditions.

  5. 05

    Performed IEC 60909 three-phase short-circuit analysis and reviewed fault levels across the LV and 11 kV buses.

  6. 06

    Completed an IEEE Std 80 ground-grid study to assess grounding arrangement, touch potential and step potential.
02 / Results & Findings

Results from the project work.

  1. 01

    Modelled annual facility demand of 9,014.4 MWh from a complete 8,760-hour dataset, with 4,380 grid-available and 4,380 grid-unavailable hours.

    Modelled result

  2. 02

    PVsyst simulated 4,333.2 MWh/year of solar energy supplied to the load, 1,508 kWh/kWp/year specific production, 67.45% performance ratio and 48.07% solar fraction.

    Modelled result

  3. 03

    Python scenario analysis estimated a 74.4% reduction in baseline diesel-generator energy for the 2.874 MWp case, equivalent to about 1.17 million litres/year of diesel avoided under the study assumptions.

    Modelled result

  4. 04

    ETAP time-series results confirmed acceptable operating-voltage behaviour in the assessed scenario, while short-circuit and grounding studies provided fault-duty and electrical-safety checks for the modelled system.

    Modelled result

Factory / Modelled PVsyst study

Solar use under zero export.

Explore monthly demand, solar used on site and energy drawn from the grid.

Explore the study Close study

Monthly energy balance

Match rooftop solar to factory demand.

2.874 MWp roof scenarioZero export

Match rooftop solar to factory demand.Reported monthly energy. Factory demand, Solar used, Grid energy. Units: MWh / month. Exact values for every sample are in the study data table below.0200400600800JanMarMayJulAugOctDecMWh / month

Select a sample or point to the chart to inspect it.

Engineering decision

Size solar around useful on-site consumption as well as roof area. The reported zero-export scenario leaves 1,012 MWh of annual energy unused.

PVsyst zero-export reportPage 4
Model assumptions & limits
  • Monthly values are transcribed from the PVsyst balances table; units in this report are MWh.
  • Solar used (E_Solar) plus grid supply (EFrGrid) equals user demand (E_User), within report rounding. Unused energy is EUnused.
  • Reported annual totals: demand 9,014.4 MWh; solar used 4,333.2 MWh; grid energy 4,681.2 MWh. Monthly rounded values may sum slightly differently.
  • Grid energy is not diesel production. This view does not estimate generator fuel savings or compare PV sizes that were not simulated.
View study data
Reported monthly energy
SampleFactory demand (MWh)Solar used (MWh)Grid energy (MWh)Unused energy (MWh)
Jan777.6372.9404.787.7
Feb691.2323.2368.081.9
Mar748.8368.5380.3105.5
Apr748.8371.5377.386.8
May748.8362.8386.085.8
Jun748.8355.1393.763.7
Jul777.6362.1415.568.9
Aug748.8337.4411.479.8
Sep748.8367.3381.570.5
Oct777.6381.7395.989.7
Nov720.0359.4360.6108.4
Dec777.6371.2406.483.5

Project Evidence

Supporting project records.

Available for Manufacturing Factory Grid–Diesel–PV Cost Reduction & Power System Analysis: Engineering Drawings · Reports / PDFs. Open an image for a closer view or select a document to read it.

01

Engineering Drawings

2 items

PDF

Engineering Drawings

ETAP Time-Series Load-Flow One-Line Diagram PDF

Original ETAP one-line drawing for the modelled grid, diesel, PV and factory-load system.

Sep 2026

View document

02

Reports / PDFs

3 items

PDF

Reports / PDFs

PVsyst 2.874 MWp Zero-Export Simulation Report

PVsyst simulation report covering system configuration, annual energy results, losses and financial outputs.

Sep 2026

View document
PDF

Reports / PDFs

ETAP IEC 60909 Fault Study Report

ETAP report covering three-phase fault-current results for the modelled LV and 11 kV buses.

Sep 2026

View document
PDF

Reports / PDFs

ETAP IEEE 80 Ground-Grid Study

Ground-grid report documenting the modelled conductor and rod arrangement with touch- and step-potential checks.

Aug 2026

View document

Related Engineering Work

Related projects.

Other case studies that use related engineering tools and methods.

More Case Studies

Compare this study with the other mini-grid, distribution and power-system projects.