Back to projects
Critical-Power Microgrid & ResilienceCompleted Technical Simulation Study

Hospital Critical-Power Microgrid Optimization & ETAP Verification

Independent critical-power microgrid study for a 300-bed hospital, combining 8,760-hour load and grid-availability modelling, HOMER techno-economic optimization, outage-resilience assessment and ETAP time-series load-flow verification for a grid/PV/BESS/diesel architecture.

Hospital Critical-Power Microgrid Optimization & ETAP Verification project visual

Project image

Location

Nigeria

Period

Sep 2026

01 / Scope of Work

Work modelled, designed or delivered.

  1. 01

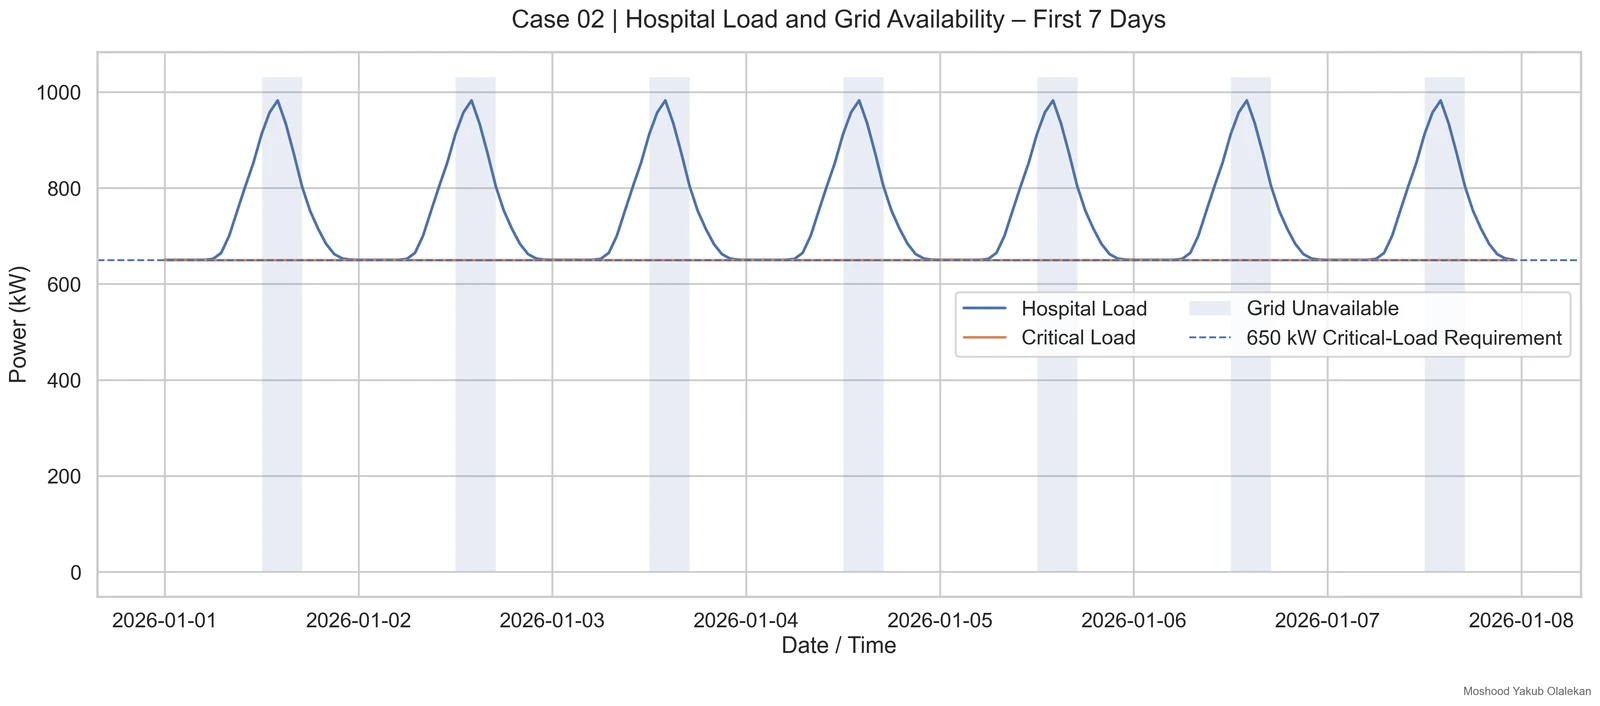
    Developed and reviewed an 8,760-hour hospital demand model with 1.20 MW peak demand, 780 kW average demand and a 650 kW critical-load requirement.

  2. 02

    Modelled grid availability at 18 hours/day and assessed a defined four-hour outage window against the requirement for uninterrupted critical-load supply.

  3. 03

    Evaluated PV capacities up to 1.2 MW, battery storage up to 2.5 MWh and PCS capacity up to 1 MW using HOMER techno-economic optimization.

  4. 04

    Compared dispatch strategies and selected the lowest-NPC feasible architecture meeting the critical-load reliability requirement.

  5. 05

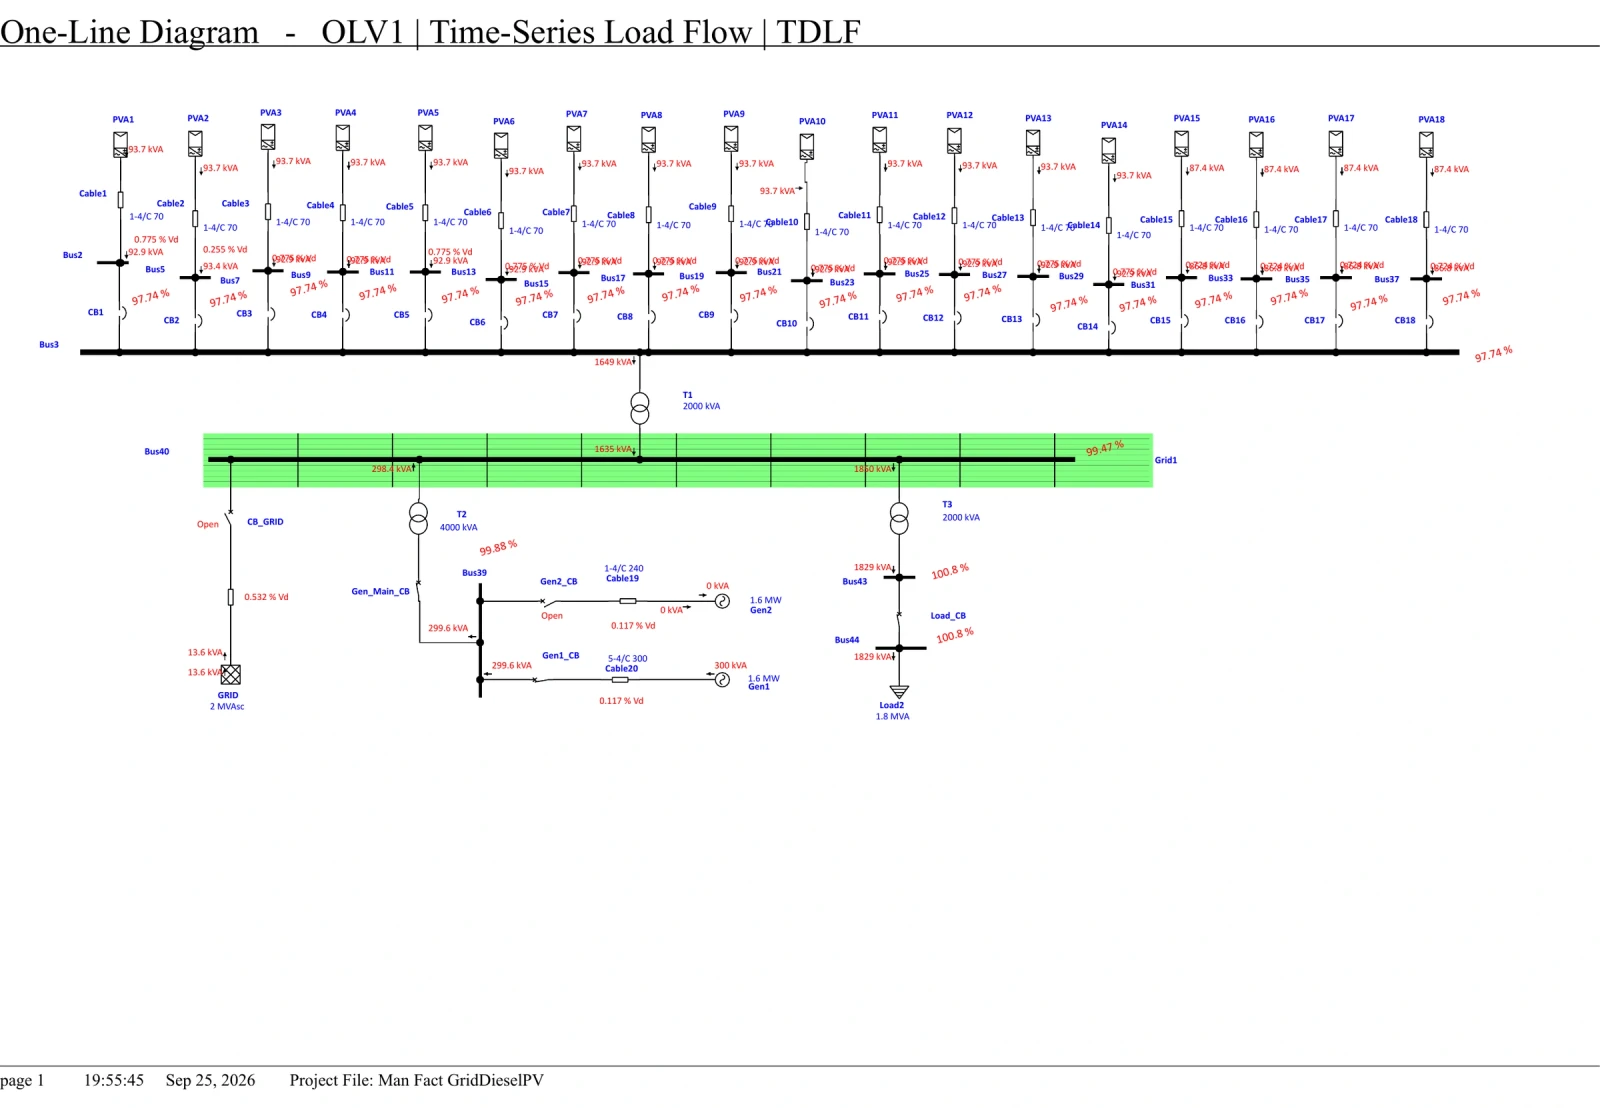
    Developed the recommended architecture in ETAP, including PV, battery/PCS, grid interface, two diesel generators, critical and non-critical hospital loads.

  6. 06

    Reviewed ETAP time-series load-flow behaviour and system operating quantities for the modelled electrical network.

  7. 07

    Prepared annual demand, load-duration, monthly demand, monthly energy and outage-availability visualisations to communicate the engineering basis of the study.
02 / Results & Findings

Results from the project work.

  1. 01

    Selected HOMER architecture: 1.2 MW PV, 2.2 MWh nominal battery storage, 704 kW system converter, two 648 kW diesel generators and a 1.2 MW grid connection using cycle-charging dispatch.

    Modelled result

  2. 02

    HOMER reported zero unmet electric load and zero capacity shortage for the selected configuration.

    Modelled result

  3. 03

    Reduced modeled net present cost from approximately $14.1 million for the base system to $9.63 million for the proposed system, with LCOE reduced from $0.180/kWh to $0.123/kWh.

    Modelled result

  4. 04

    Achieved a modeled 30.7% IRR, 3.72-year discounted payback and 3.25-year simple payback under the study assumptions.

    Modelled result

  5. 05

    Reduced modeled annual diesel consumption from 401,069 litres in the base system to 57,376 litres in the proposed configuration.

    Modelled result

  6. 06

    ETAP one-line and time-series load-flow modelling provided an electrical-system verification layer for the optimized critical-power architecture.

    Modelled result

Hospital / Modelled HOMER study

Critical power & storage dispatch.

Inspect selected operating days, battery state of charge and annual energy sources.

Explore the study Close study

Selected operating days

Follow supply, demand and battery operation.

Hourly HOMER exportCycle charging

Follow supply, demand and battery operation.01 Jan · first modelled day. AC demand, Solar PV, Grid imports, Both generators, Battery AC net. Units: kW. Exact values for every sample are in the study data table below.-1000-50005001000150000:0004:0008:0012:0015:0019:0023:00kW

Select a sample or point to the chart to inspect it.

Engineering decision

Inspect storage and generator support during hours with no grid imports. Confirm the grid-availability schedule separately before using this view to establish outage autonomy.

Hospital HOMER reportPage 6
Model assumptions & limits
  • Three selected days come from the complete 8,760-hour 2026 export: the first day, the annual peak-demand day and the day with greatest generator energy. They are examples, not the full annual dispatch.
  • Grid purchases are column M of the supplied export. Zero purchases do not identify an outage. The export contains neither grid availability nor grid sales, so outage timings and exports are not plotted.
  • AC demand, dedicated PV inverter output, grid imports and combined generator output are in kW. Battery AC net is system inverter output minus rectifier input: positive supplies the AC bus; negative charges from it.
  • Battery charge/discharge readings are on the DC side and differ from AC net power because of conversion losses. SOC is the reported end-of-hour state of charge.
  • The annual demand, PV, generator and grid totals agree with the published report within 1 kWh. Unmet-load values below 0.00000001 kW are numerical noise and are displayed as zero.
  • Timestamps are displayed as exported; no timezone was supplied. These are modelled results, not evidence of a field outage test.
View study data
01 Jan · first modelled day
SampleAC demand (kW)Solar PV (kW)Grid imports (kW)Both generators (kW)Battery AC net (kW)Generator 1 (kW)Generator 2 (kW)Battery SOC (%)Battery DC charge (kW)Battery DC discharge (kW)Unmet load (kW)
00:00650.00.00.00.0650.00.00.067.30.0682.70.0
01:00650.00.00.00.0650.00.00.034.60.0682.60.0
02:00650.00.0558.90.091.10.00.030.00.095.70.0
03:00650.00.01,200.00.0-550.00.00.052.6523.70.00.0
04:00650.00.01,200.00.0-550.00.00.075.2523.70.00.0
05:00650.10.01,200.00.0-549.90.00.097.7523.60.00.0
06:00652.10.0652.10.00.00.00.097.70.00.00.0
07:00664.5165.3499.20.00.00.00.097.70.00.00.0
08:00700.4438.7261.70.00.00.00.097.70.00.00.0
09:00752.6366.7385.90.00.00.00.097.70.00.00.0
10:00803.8402.9400.90.00.00.00.097.70.00.00.0
11:00852.7781.471.20.00.00.00.097.70.00.00.0
12:00650.0576.40.00.073.60.00.094.00.077.30.0
13:00650.0581.90.00.068.10.00.090.60.071.50.0
14:00650.0390.50.00.0259.50.00.077.60.0272.50.0
15:00650.0318.20.00.0331.80.00.060.90.0348.50.0
16:00650.0253.20.0162.0234.8162.00.049.00.0246.60.0
17:00650.0175.30.0648.0-173.3648.00.056.2165.00.00.0
18:00752.60.01,200.0292.1-739.5292.10.086.5704.10.00.0
19:00715.00.0715.00.00.00.00.086.50.00.00.0
20:00683.30.0683.30.00.00.00.086.50.00.00.0
21:00662.00.0662.00.00.00.00.086.50.00.00.0
22:00652.90.0652.90.00.00.00.086.50.00.00.0
23:00650.40.0650.40.00.00.00.086.50.00.00.0
2026-06-01 · annual peak demand
SampleAC demand (kW)Solar PV (kW)Grid imports (kW)Both generators (kW)Battery AC net (kW)Generator 1 (kW)Generator 2 (kW)Battery SOC (%)Battery DC charge (kW)Battery DC discharge (kW)Unmet load (kW)
00:00650.50.0650.50.00.00.00.082.10.00.00.0
01:00650.20.0650.20.00.00.00.082.10.00.00.0
02:00650.10.0650.10.00.00.00.082.10.00.00.0
03:00650.10.0650.10.00.00.00.082.10.00.00.0
04:00650.20.0650.20.00.00.00.082.10.00.00.0
05:00651.30.0651.30.00.00.00.082.10.00.00.0
06:00657.736.2621.60.00.00.00.082.10.00.00.0
07:00685.2241.7443.50.00.00.00.082.10.00.00.0
08:00751.3470.0281.20.00.00.00.082.10.00.00.0
09:00839.4580.5258.90.00.00.00.082.10.00.00.0
10:00922.4609.6312.90.00.00.00.082.10.00.00.0
11:00999.8738.7261.20.00.00.00.082.10.00.00.0
12:00650.0874.20.00.0-224.20.00.091.3213.50.00.0
13:00650.0863.80.00.0-212.70.00.0100.0202.60.00.0
14:00650.0743.20.00.00.00.00.0100.00.00.00.0
15:00650.0561.90.00.088.10.00.095.60.092.50.0
16:00650.0444.10.00.0205.90.00.085.20.0216.20.0
17:00650.0212.00.00.0438.00.00.063.20.0460.00.0
18:00839.49.91,200.00.0-370.40.00.078.4352.70.00.0
19:00776.30.01,200.00.0-423.70.00.095.8403.40.00.0
20:00720.60.0720.60.00.00.00.095.80.00.00.0
21:00680.10.0680.10.00.00.00.095.80.00.00.0
22:00659.70.0659.70.00.00.00.095.80.00.00.0
23:00652.60.0652.60.00.00.00.095.80.00.00.0
2026-12-21 · highest daily generator output
SampleAC demand (kW)Solar PV (kW)Grid imports (kW)Both generators (kW)Battery AC net (kW)Generator 1 (kW)Generator 2 (kW)Battery SOC (%)Battery DC charge (kW)Battery DC discharge (kW)Unmet load (kW)
00:00650.00.0650.00.00.00.00.081.80.00.00.0
01:00650.00.0650.00.00.00.00.081.80.00.00.0
02:00650.00.0650.00.00.00.00.081.80.00.00.0
03:00650.00.0650.00.00.00.00.081.80.00.00.0
04:00650.00.0650.00.00.00.00.081.80.00.00.0
05:00650.10.0650.10.00.00.00.081.80.00.00.0
06:00652.10.0652.10.00.00.00.081.80.00.00.0
07:00664.548.1616.50.00.00.00.081.80.00.00.0
08:00700.497.1603.40.00.00.00.081.80.00.00.0
09:00752.657.9694.70.00.00.00.081.80.00.00.0
10:00803.8154.5649.30.00.00.00.081.80.00.00.0
11:00852.7150.5702.20.00.00.00.081.80.00.00.0
12:00650.065.00.00.0585.00.00.052.40.0614.40.0
13:00650.046.30.0162.0441.7162.00.030.20.0463.80.0
14:00650.0110.40.01,279.1-739.5648.0631.160.5704.10.00.0
15:00650.0182.80.0648.0-180.8648.00.068.0172.20.00.0
16:00650.0100.00.0648.0-98.0648.00.072.093.40.00.0
17:00650.034.60.0648.0-32.6648.00.073.331.00.00.0
18:00752.60.01,200.0202.5-649.9202.50.0100.0618.90.00.0
19:00715.00.0715.00.00.00.00.0100.00.00.00.0
20:00683.30.0683.30.00.00.00.0100.00.00.00.0
21:00662.00.0662.00.00.00.00.0100.00.00.00.0
22:00652.90.0652.90.00.00.00.0100.00.00.00.0
23:00650.40.0650.40.00.00.00.0100.00.00.00.0

Annual energy sources

See where the modelled energy comes from.

6,076.247 MWh servedReported unmet load: 0

See where the modelled energy comes from.Reported annual production. Annual production. Units: MWh / year. Exact values for every sample are in the study data table below.0200040006000Solar PVGenerator 1Generator 2Grid purchasesMWh / year

Select a sample or point to the chart to inspect it.

Engineering decision

Read the production mix alongside served demand, excess generation and storage losses when assessing the selected hybrid architecture.

Hospital HOMER reportPage 6
Model assumptions & limits
  • Annual source production totals 6,223.585 MWh. The report records 71.263 MWh of excess electricity.
  • Production share is a share of generated and purchased energy, not the renewable fraction of energy served. Storage and conversion losses separate production from consumption.
  • Served energy is the report’s AC primary-load consumption.
  • These are annual HOMER results for the selected configuration, not measured operating performance or an hourly dispatch forecast.
View study data
Reported annual production
SampleAnnual production (MWh)Production share (%)
Solar PV1,983.131.9
Generator 1198.83.2
Generator 28.90.1
Grid purchases4,032.764.8

Project Evidence

Supporting project records.

Available for Hospital Critical-Power Microgrid Optimization & ETAP Verification: Engineering Drawings · Reports / PDFs. Open an image for a closer view or select a document to read it.

01

Engineering Drawings

6 items

PDF

Engineering Drawings

ETAP Hospital Critical-Power One-Line Diagram

ETAP one-line and time-series load-flow model incorporating PV arrays, PCS and battery system, two diesel generators, grid interface, transformer, and separate critical and non-critical hospital loads.

Sep 2026

View document

02

Reports / PDFs

1 item

PDF

Reports / PDFs

HOMER Critical-Power Microgrid Simulation Report

HOMER report covering the selected system architecture, cost summary, electrical balance, PV and battery performance, grid purchases, diesel consumption and economic comparison with the base system.

Sep 2026

View document

Related Engineering Work

Related projects.

Other case studies that use related engineering tools and methods.

More Case Studies

Compare this study with the other mini-grid, distribution and power-system projects.