Back to projects
Energy Systems AnalysisCompleted Technical Study

Fapote Mini-Grid - Demand Analytics & HOMER Optimization

Integrated mini-grid demand and techno-economic assessment combining Odyssey demand modelling, Python-based validation and analysis of an 8,760-hour annual load profile, and HOMER Pro engineering and client optimization studies. The workflow established the community demand baseline, characterized temporal and customer-segment consumption patterns, and supported evaluation of the hybrid power-system configuration.

Fapote Mini-Grid - Demand Analytics & HOMER Optimization project visual

Project image

Location

Fapote, Nigeria

Period

2026

658.1 MWh/yr

Annual Community Demand

Modelled result

8,760

Hourly Records Analysed

Modelled result

01 / Scope of Work

Work modelled, designed or delivered.

  1. 01

    Reviewed and processed the Odyssey-derived Fapote annual community load profile containing 8,760 hourly records.

  2. 02

    Validated the annual dataset in Python for record completeness, demand consistency and hourly time-series structure.

  3. 03

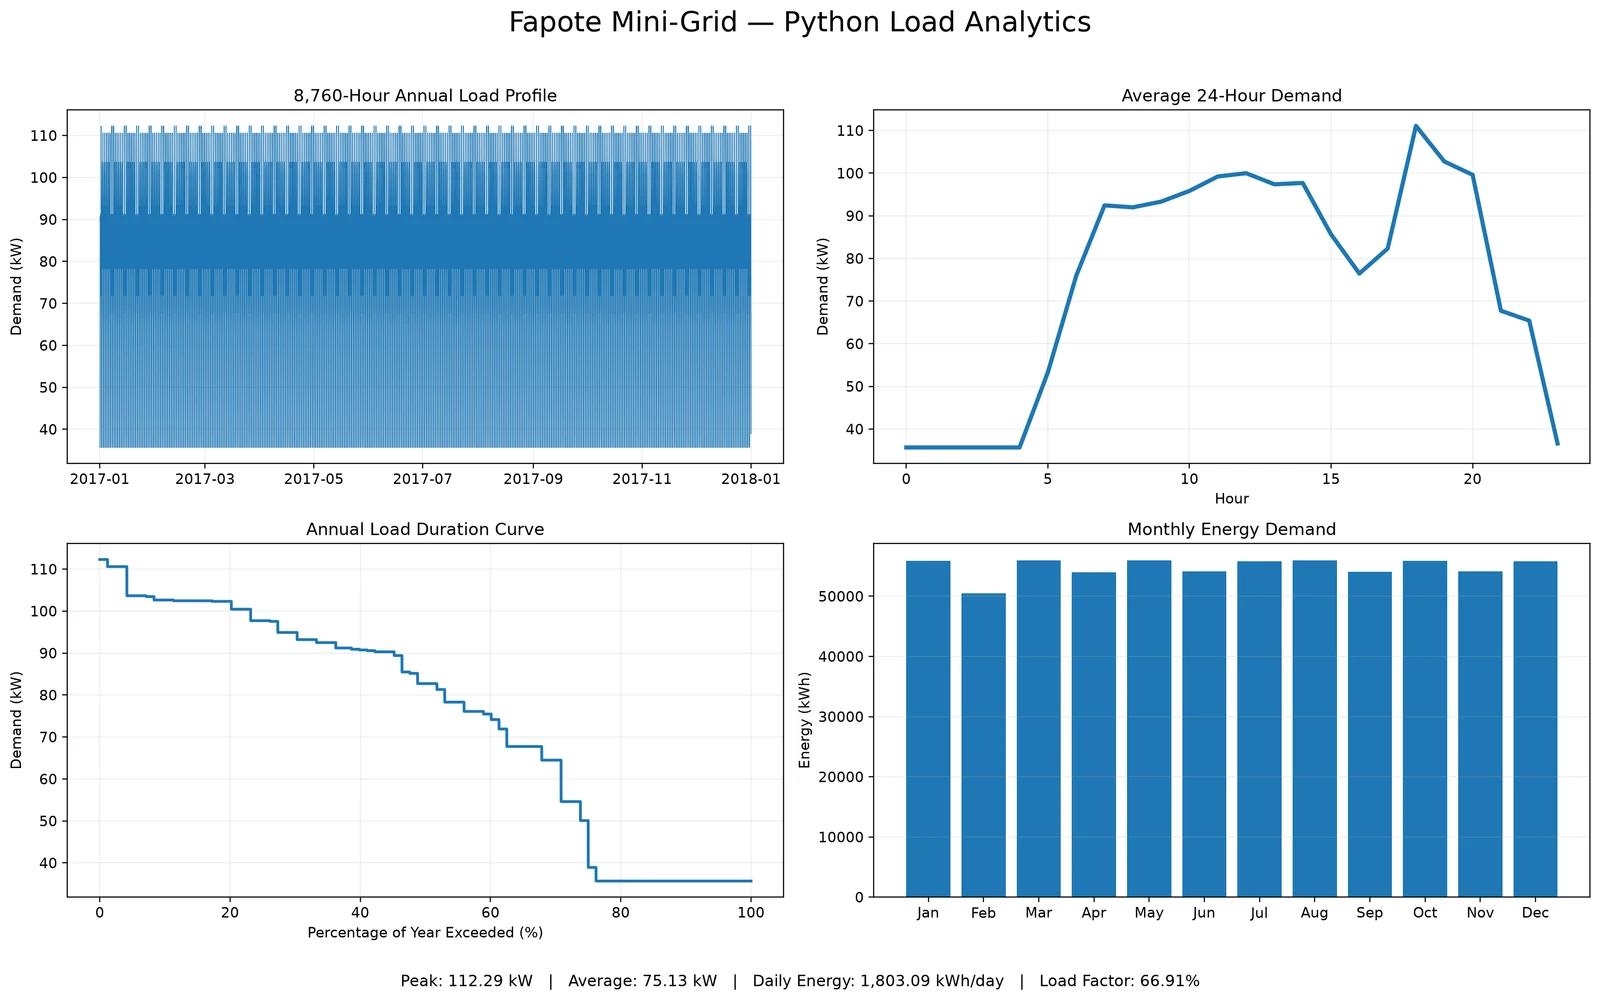
    Calculated peak demand, minimum demand, average load, daily energy consumption, annual energy consumption and system load factor.

  4. 04

    Developed demand heatmaps, monthly energy analysis, customer-segment profiles and energy-ranking visualizations.

  5. 05

    Evaluated the temporal behaviour of residential, commercial, productive-use and other modelled demand segments.

  6. 06

    Reviewed the HOMER Pro engineering simulation for the proposed hybrid mini-grid architecture.

  7. 07

    Reviewed the client optimization simulation and associated technical and economic system results.
02 / Results & Findings

Results from the project work.

  1. 01

    Validated a complete 8,760-hour annual community demand profile.

    Modelled result

  2. 02

    Calculated a peak system demand of 112.29 kW and a minimum demand of 35.68 kW.

    Modelled result

  3. 03

    Calculated an average system demand of 75.13 kW.

    Modelled result

  4. 04

    Calculated average daily energy consumption of approximately 1,803.09 kWh/day.

    Modelled result

  5. 05

    Calculated annual community electricity demand of approximately 658,128 kWh/year.

    Modelled result

  6. 06

    Confirmed a system load factor of 66.91%, indicating relatively sustained utilization across the annual demand profile.

    Modelled result

  7. 07

    Produced temporal and customer-segment analytics to identify daily demand behaviour, monthly energy variation and the relative contribution of different load categories.

    Modelled result

  8. 08

    Prepared engineering and client-facing HOMER Pro simulation assessments for the Fapote hybrid mini-grid study.

    Modelled result

Fapote / Modelled demand & HOMER study

Demand shape & hybrid supply.

Explore the average daily demand and the selected system’s annual energy sources.

Explore the study Close study

Daily demand shape

Follow demand through an average day.

8,760 modelled hoursAnnual peak 112.3 kW

Follow demand through an average day.Annual average by hour of day. Total demand, Residential, Commercial + productive, Anchor + public. Units: kW / average hour. Exact values for every sample are in the study data table below.05010015000:0004:0008:0012:0015:0019:0023:00kW / average hour

Select a sample or point to the chart to inspect it.

Engineering decision

Use the customer-group demand shape to assess solar alignment, evening supply and storage requirements.

Published demand profileView source
Model assumptions & limits
  • Each point averages the same hour over all 365 days of the modelled 8,760-hour profile. Input load values are already in kW.
  • The CSV uses a 2017 reference calendar. It is a modelled demand profile, not a record of measurements taken in 2017.
  • An average day smooths seasonal and day-to-day peaks. The annual peak shown above is from the complete profile, not the average-day curve.
  • Business demand combines commercial and productive uses. Services combine anchor and public loads. Only group totals are published; customer identifiers stay private.
View study data
Annual average by hour of day
SampleTotal demand (kW)Residential (kW)Commercial + productive (kW)Anchor + public (kW)
00:0035.728.83.33.6
01:0035.728.83.33.6
02:0035.728.83.33.6
03:0035.728.83.33.6
04:0035.728.83.33.6
05:0053.343.24.45.7
06:0075.957.66.112.2
07:0092.457.67.827.0
08:0092.028.817.345.9
09:0093.323.622.946.8
10:0095.823.624.747.6
11:0099.223.627.048.7
12:00100.023.628.747.8
13:0097.423.628.745.1
14:0097.723.628.745.5
15:0085.623.627.035.1
16:0076.523.620.032.9
17:0082.357.612.212.5
18:00111.186.411.912.7
19:00102.786.49.96.4
20:0099.686.48.25.0
21:0067.757.66.53.6
22:0065.457.64.23.6
23:0036.628.84.23.6

Annual energy sources

See where the modelled energy comes from.

658.225 MWh servedReported unmet load: 0

See where the modelled energy comes from.Reported annual production. Annual production. Units: MWh / year. Exact values for every sample are in the study data table below.0200400600800Solar PVDieselGrid purchasesMWh / year

Select a sample or point to the chart to inspect it.

Engineering decision

Read the production mix alongside served demand, excess generation and storage losses when assessing the selected hybrid architecture.

HOMER engineering reportPage 6
Model assumptions & limits
  • Annual source production totals 764.678 MWh. The report records 72.282 MWh of excess electricity.
  • Production share is a share of generated and purchased energy, not the renewable fraction of energy served. Storage and conversion losses separate production from consumption.
  • Served energy is the report’s AC primary-load consumption.
  • These are annual HOMER results for the selected configuration, not measured operating performance or an hourly dispatch forecast.
View study data
Reported annual production
SampleAnnual production (MWh)Production share (%)
Solar PV633.982.9
Diesel101.113.2
Grid purchases29.73.9

Sites & Work Packages

Work covered by each site.

Site-level scope recorded for this assignment.

01

Demand Modelling & Validation

Processed and validated the 8,760-hour Odyssey-derived Fapote demand dataset and established the annual simulation baseline.

02

Python Energy Analytics

Calculated system demand and energy KPIs and developed heatmaps, monthly energy analysis and customer-segment demand visualizations.

03

Hybrid System Simulation

Reviewed the HOMER Pro engineering and client optimization studies for technical performance and hybrid-system configuration assessment.

Project Evidence

Supporting project records.

Available for Fapote Mini-Grid - Demand Analytics & HOMER Optimization: Engineering Drawings · Reports / PDFs. Open an image for a closer view or select a document to read it.

01

Engineering Drawings

5 items

02

Reports / PDFs

3 items

PDF

Reports / PDFs

Case 1 - Odyssey Community Load Assessment

Odyssey simulation assessment establishing the Fapote community demand model and annual electricity-load baseline.

Jun 2026

View document
PDF

Reports / PDFs

Case 2 - HOMER Pro Engineering Simulation

Engineering assessment of the Fapote hybrid mini-grid configuration and its modelled technical performance in HOMER Pro.

Jun 2026

View document
PDF

Reports / PDFs

Case 3 - HOMER Pro Client Optimization

Client-facing HOMER Pro optimization assessment presenting the evaluated hybrid-system configuration and simulation results.

Jun 2026

View document

More Case Studies

Compare this study with the other mini-grid, distribution and power-system projects.